By David Kreutter, Senior Lecturer and Associate Academic Director, Master of Science in Applied Analytics
In my courses for Columbia's M.S. in Applied Analytics program, I emphasize analytical thinking as one of the most critical skills for my students to master, since it underpins effective work as a data analyst or data scientist. Analytical thinking is the process of breaking down a complex problem into its parts, evaluating the components, and deriving evidence-based insights to inform a decision. For example, we may be presented with a request to understand why a business has experienced a decline in sales over the last two quarters. We would parse this problem into online and retail store sales, volume of individual product sales, number of new and repeat customers, advertising and promotional activities, etc. We would then collect and analyze data to identify patterns between the components. Finally, we would synthesize our findings and present a recommendation for action to the decision maker. Thus, we start with a concept, work through the details, and identify and integrate patterns into a meaningful and compelling “big picture” that evokes a response, i.e., a decision.
Many artists use a similar process in their creative journey. They start with the concept that they want to create. They plan the materials and the technique based on their concept, e.g., oils, watercolors, brushes, knives, sponges. They analyze the visual elements required for their work, e.g., perspective, proportions, lighting, shadows, and highlights, and they ultimately create a work of art that elicits an emotional reaction from the viewer.
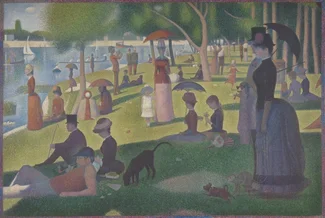
Georges Seurat was one of the founding fathers of Pointillism, a post-impressionist art movement in the late 19th century. Seurat used small dots of pure color that blended into a cohesive image when viewed from a distance. One of Seurat’s most famous works is A Sunday Afternoon on the Island of La Grande Jatte. If we zoom in on a part of the painting, we see dots of color but have no idea what story it portrays.

A Sunday on La Grande Jatte — 1884, Georges Seurat: Art Institute of Chicago, Helen Birch Bartlett Memorial Collection, CC0 Public Domain Designation
As we zoom out, we start to discern patterns, e.g., a little girl, but we still don’t understand the full story.

We have to zoom out fully to understand that Seurat was depicting a scene of Parisians enjoying a leisure day on the island of La Grande Jatte, strolling, relaxing by the river, and engaging in leisure activities. We can still see that the work was created with dots of color, but we now see the “big picture.”
What can we learn from Seurat and Pointillism to make us better analysts? Like an artist, we have to start with purpose—framing the problem we are trying to solve. We work at the level of detailed data, which is our version of working at the level of dots of color. We do exploratory data analysis to create patterns in the data. Finally, much like Seurat did, we integrate patterns in the data into a compelling image. Zooming out helps us identify new patterns in our data and create new insights. Even more importantly, zooming out enables us to tell the story of our work and provide the basis for our insights. Like a work of art, our analysis must elicit a response, i.e., a decision to act on our insights, to be impactful.
About the Program
Columbia University’s Master of Science in Applied Analytics prepares students with the practical data and leadership skills to succeed. The program combines in-depth knowledge of data analytics with the leadership, management, and communication principles and tactics necessary to impact decision-making across industries and organizational functions.
Learn more about the program here. The program is available full-time and part-time, online and on-campus.


